
Reports Module
Reports will provide important detail that can be used to help develop future forecasts, marketing plans, guide budget planning, and improve decision-making. Managers also use business reports to track progress and growth and identify trends or any irregularities that may need further assessment and evaluation.
To access the Reports Dashboard page, select and click Reports Module from the top menu.
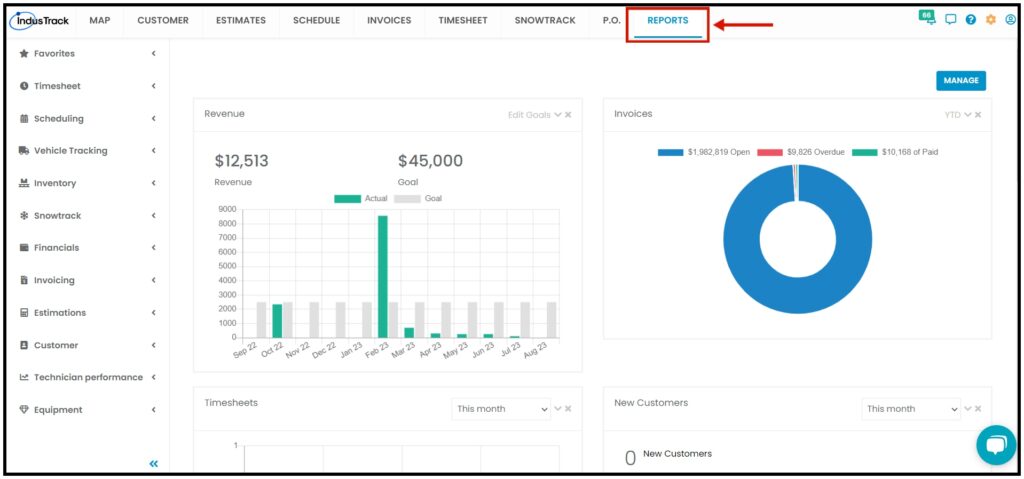
- The default page is where you can see its sub-categories found on the left-hand side after clicking on the Reports Module from the top. A summary in graphs and figures is also available on the Reports Default Page where you can easily see the running performance, status, and/or progress on a given period.
- There are ten (10) summaries of reports shown in graphs, tables, or figures in this window that will easily tell you each of its status or progress:
- Revenue – the price of goods & services x number of units sold or the number of customers.
- Invoices – list of services provided, with a statement of the sum due; a bill.
- Timesheets – a record of the amount of a technician’s time spent on each job.
- New Customers – new leads or an entity that has no previous record of transaction of services.
- Job Dashboard – summary of all the jobs in a given period and their total revenue.
- Estimates converted to Jobs – summary of jobs won and lost.
- Job By Value Dashboard – summary of all jobs’ value in a given period and their statuses (Completed, Approved, and Invoiced).
- Top 5 Idle Vehicles – Top 5 vehicles that have the most idle time by hours.
- Customer Activity – Field Employee’s activity on customers they are working on.
- Top 5 Speeding Vehicles – Top 5 vehicles that have the most speed by mph.
Manage Dashboard
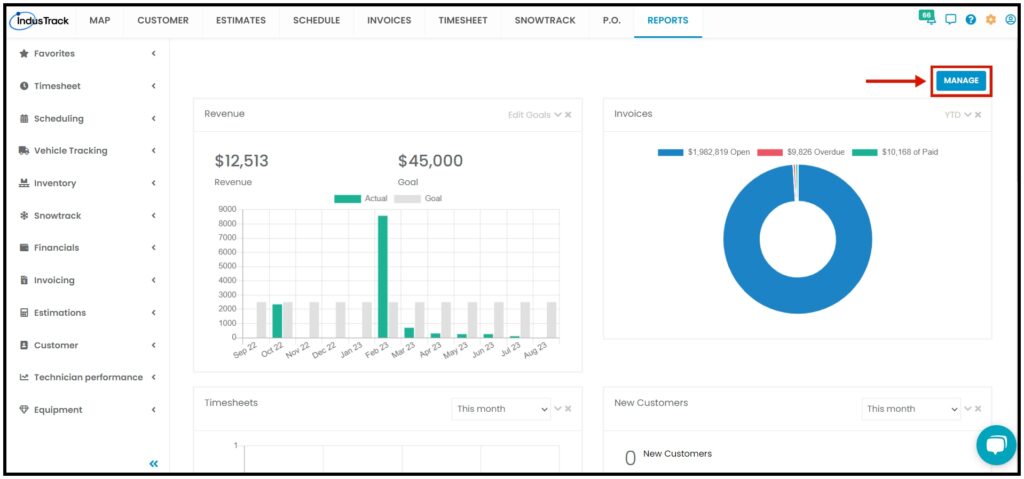
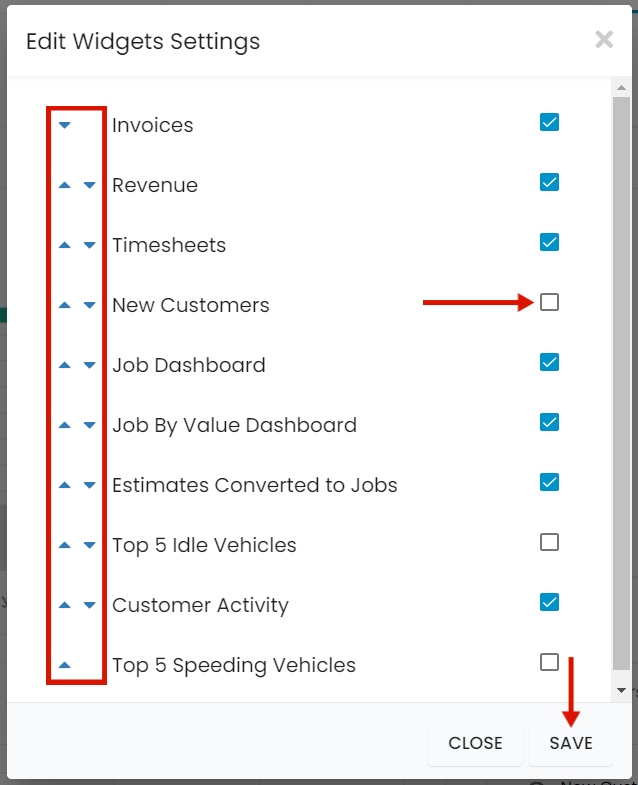
By clicking on Manage, you will be able to arrange each widget in any order you want and remove them if you don’t need to see them.
- Click on the Arrow Up and Down from the left-hand side to arrange them in the order of your liking.
- Remove widgets from the dashboard by unchecking the box from the right-hand side.
- Click on Save to apply the changes
Let us look at each of these reports.
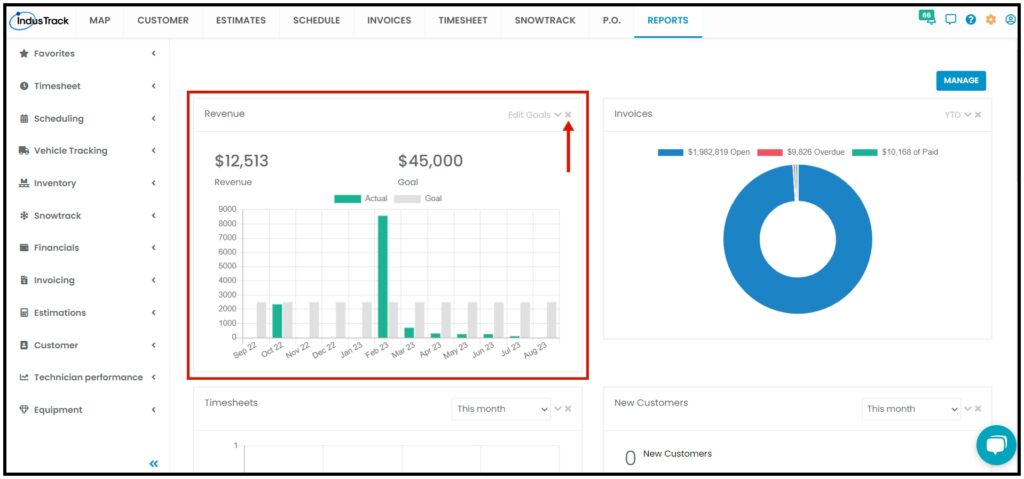
Revenue Report

- In this report, you can find a graph of your set goal for your revenue making it easier for you to see if you are hitting your set goal on a monthly basis.
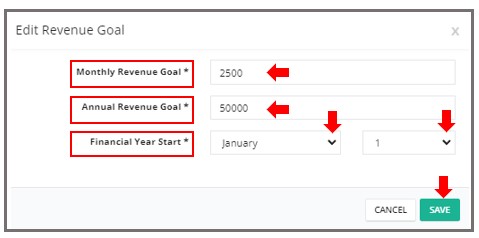
- If you wish to edit the set goal at any given time to check how far you are from your goal, you can actually do so. Click on Edit Goals.

- Click Edit Goals
- Set Monthly Revenue Goal in the Field Box
- Set Annual Revenue Goal in the Field Box
- Set the Financial Year Start
- Typically, the Financial year starts every 1st of January
- Click Save
Click on the X Icon to remove the widget from the Dashboard.
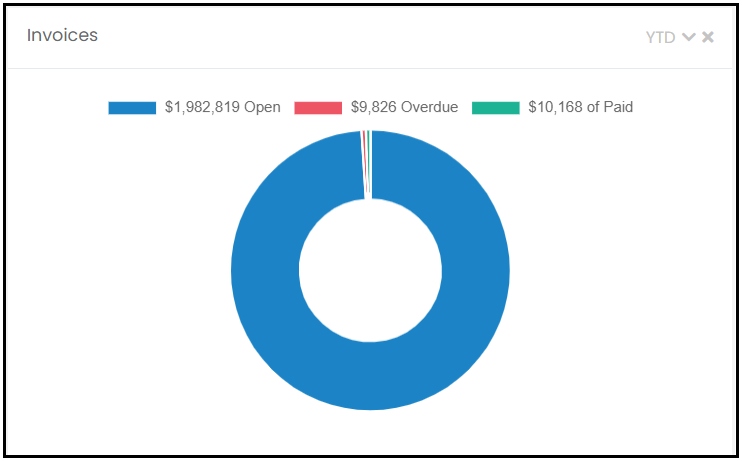
Invoice Report
In this report, you can find your year-to-date open invoices, overdue invoices, and Paid Invoices.
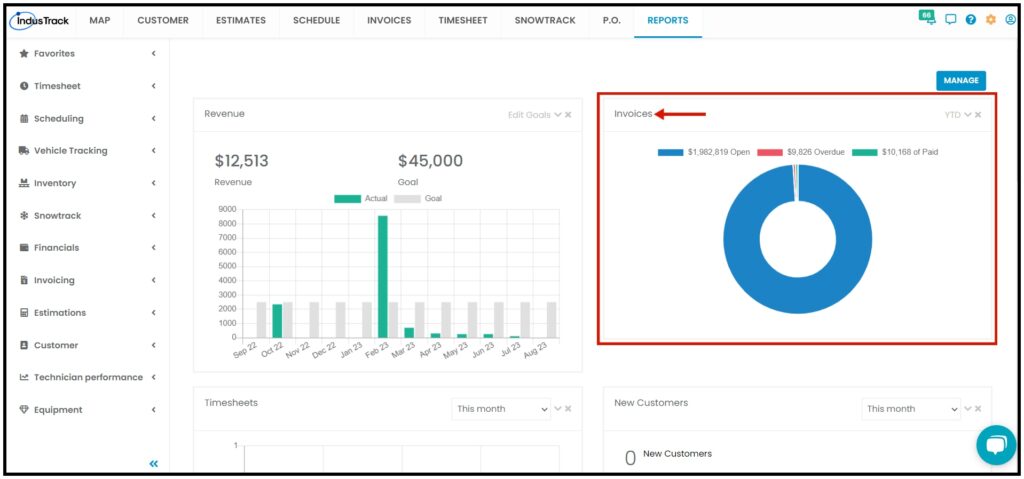
- Open Invoices – invoices to clients that have pending payment.
- Overdue Invoices – invoices that are already beyond the due date and are pending payment.
- Paid Invoices – invoices that have already been paid.
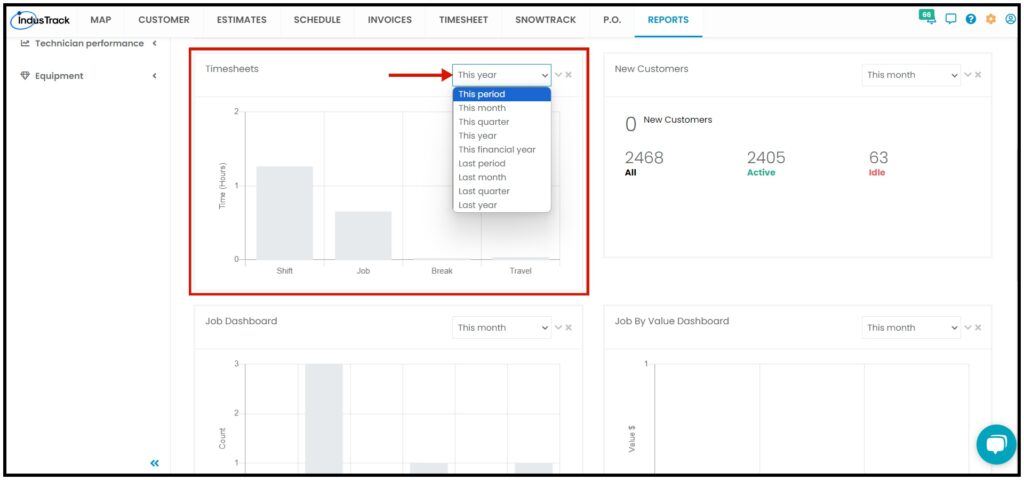
Timesheet Report
In this report you can find the Time or Hours spent for each of the following:
- Shift
- Job
- Break
- Travel
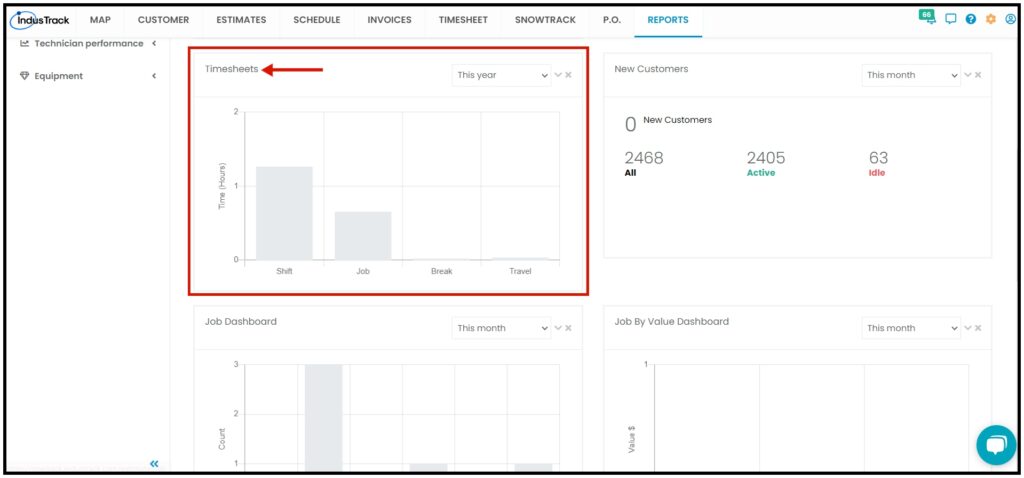
You can also select the period you want to view Timesheet Report as a summary; click on the drop-down arrow and select the period. Graph data will vary depending on the period you will select.
- This period
- This month
- This quarter
- This year
- This financial year
- Last period
- Last month
- Last quarter
- Last year
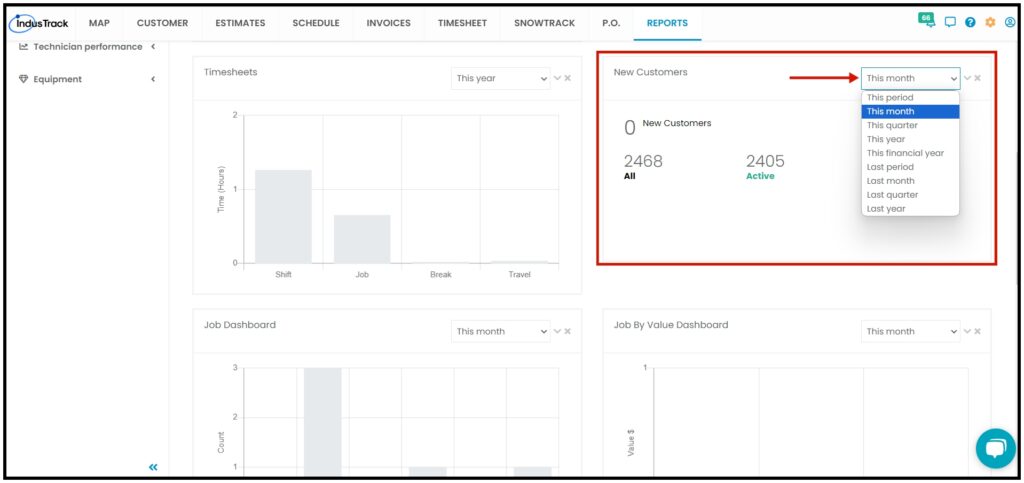
New Customers
In this report, you can find the Total Number of customers in a given period, Total Active Customers, and Total Idle
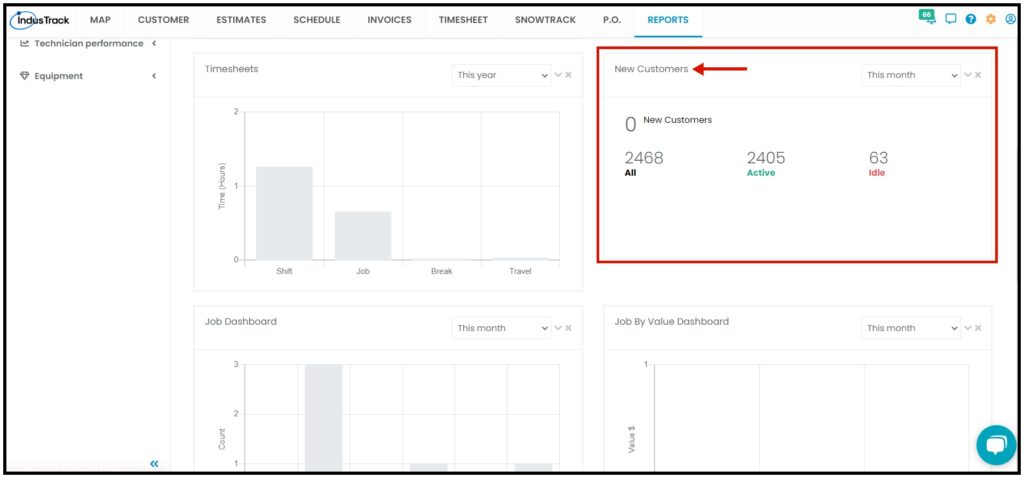
You can also select the period you want to view New Customers Report as a summary; click on the drop-down arrow and select the period.
- This period
- This month
- This quarter
- This year
- This financial year
- Last period
- Last month
- Last quarter
- Last year
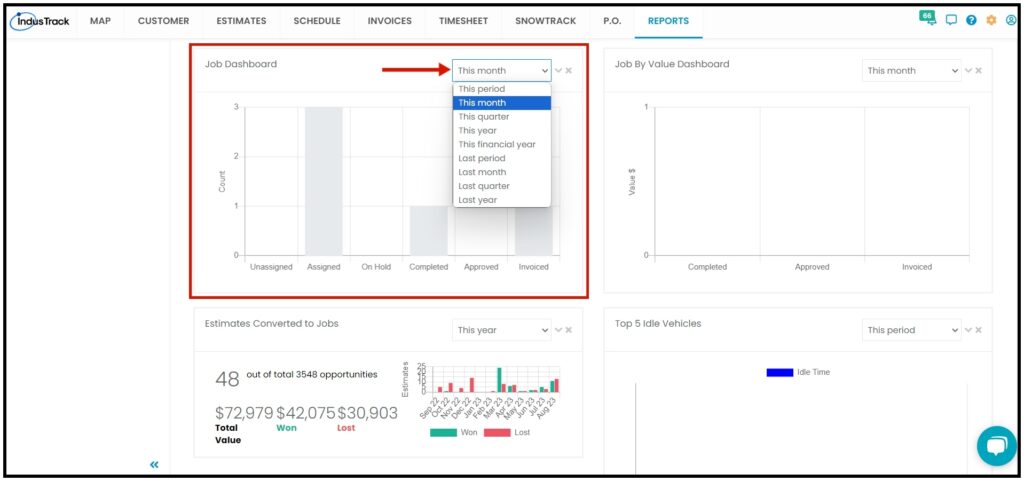
Job Dashboard Report
In this report, you can find the total number of jobs, total repeating jobs, and their total revenue in a given period.
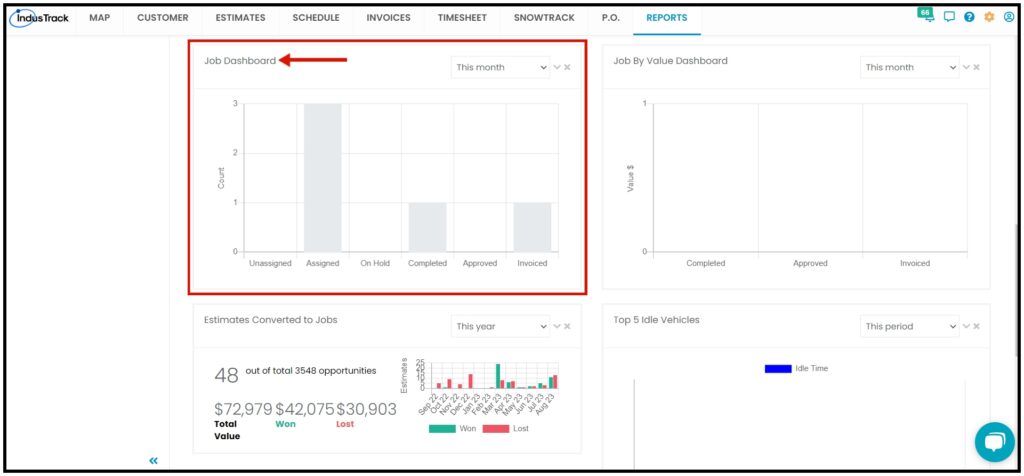
You can also select the period you want to view Job Dashboard Report as a summary; click on the drop-down arrow and select the period.
- This period
- This month
- This quarter
- This year
- This financial year
- Last period
- Last month
- Last quarter
- Last year
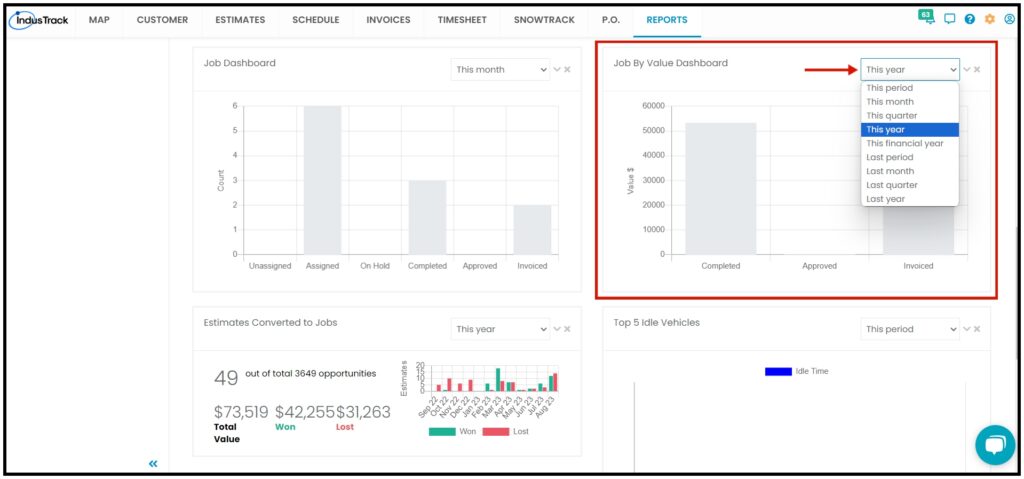
Job By Value Dashboard
In this report, you can find the total number of completed jobs, approved jobs, and invoiced jobs and their total value in a given period.
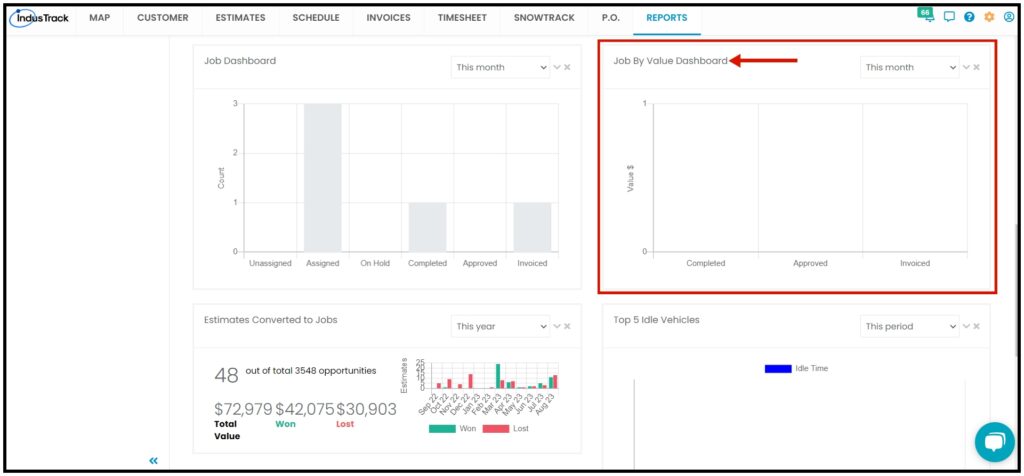
You can also select the period you want to view the Jobs By Value Dashboard as a summary; click on the drop-down arrow and select the period.
- This period
- This month
- This quarter
- This year
- This financial year
- Last period
- Last month
- Last quarter
- Last year
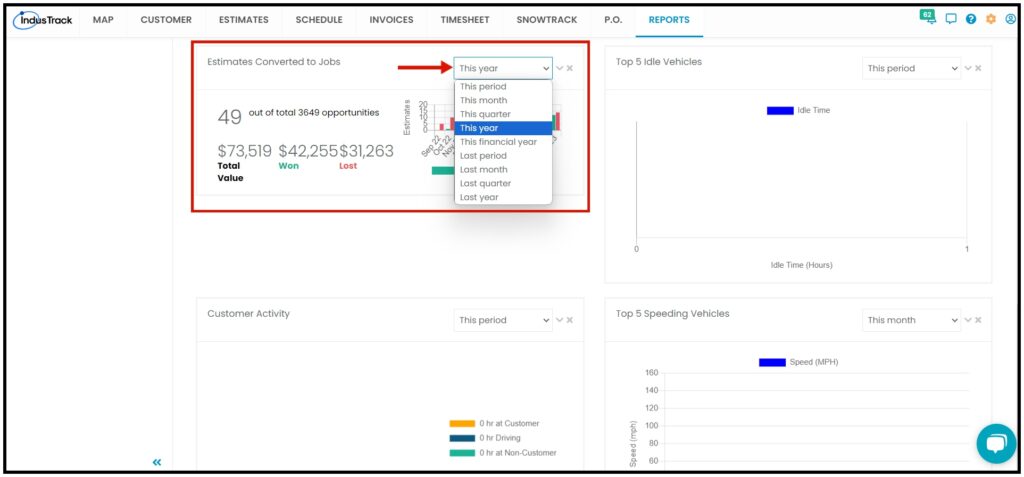
Estimates Converted to Jobs Report
In this report, you can find the total number of estimates you won and lost and how much in a given period.
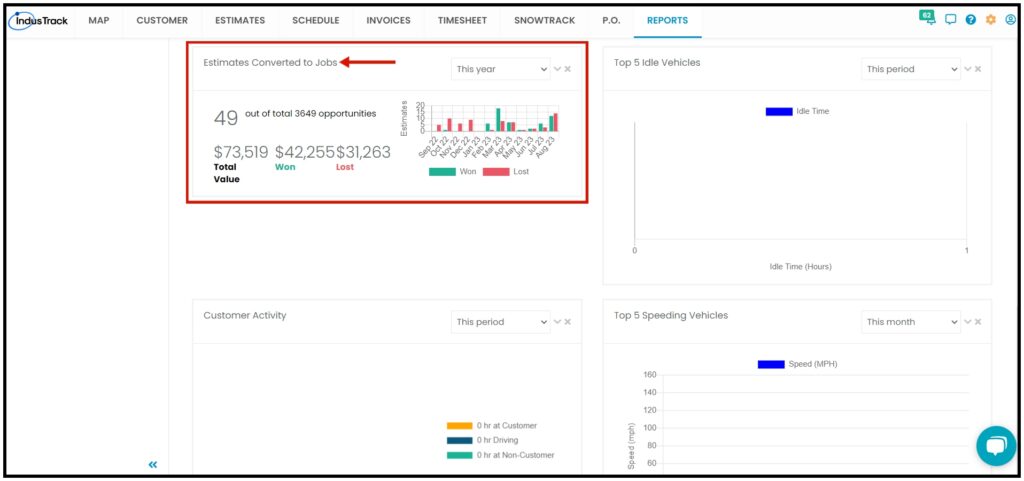
You can also select the period you want to view Estimates Converted to Jobs Report as a summary; click on the drop-down arrow and select the period.
- This period
- This month
- This quarter
- This year
- This financial year
- Last period
- Last month
- Last quarter
- Last year
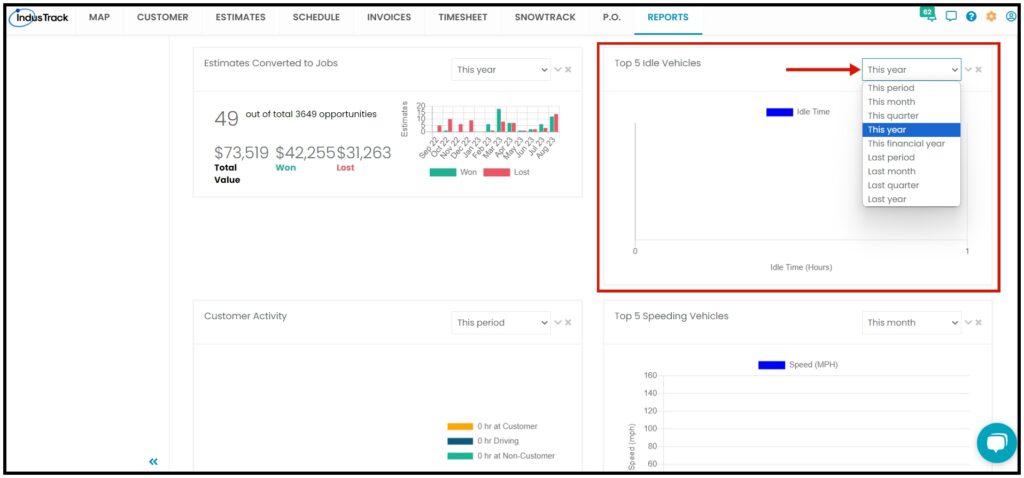
Top 5 Idle Vehicles Report
In this report, you can find the Top 5 vehicles that have the most idle time by hours in a given period.
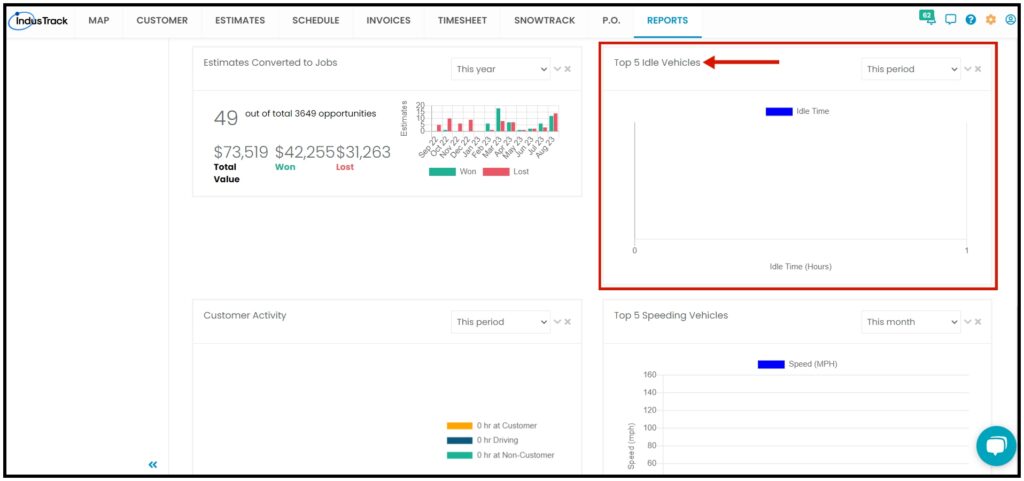
You can also select the period you want to view Top 5 Idle Vehicles as a summary; click on the drop-down arrow and select the period.
- This period
- This month
- This quarter
- This year
- This financial year
- Last period
- Last month
- Last quarter
- Last year
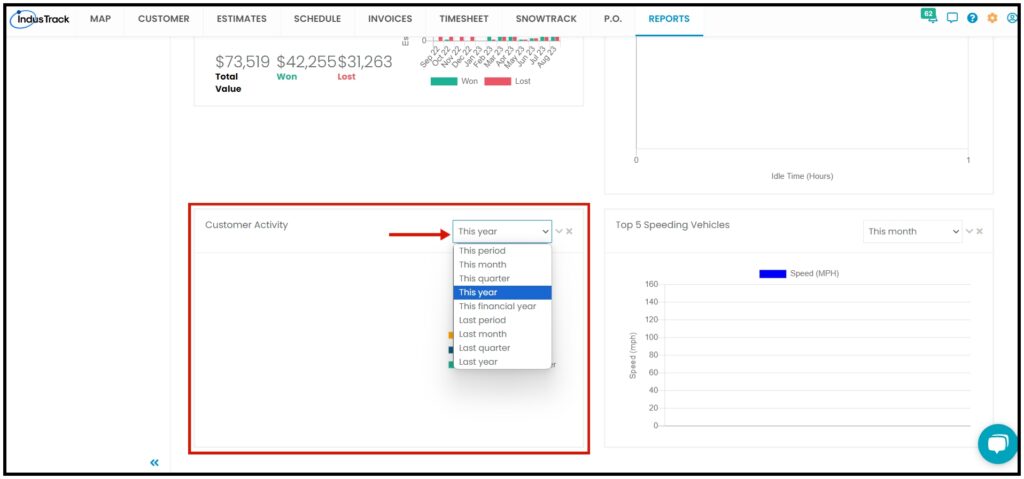
Customer Activity Report
In this report, you can find Field Employee’s activity on customers they are working on in a given period.
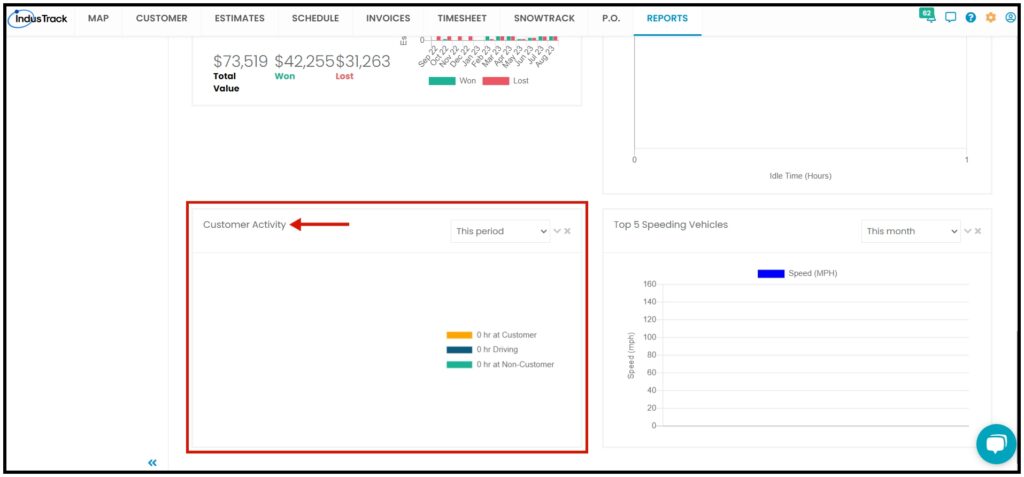
You can also select the period you want to view Top 5 Idle Vehicles as a summary; click on the drop-down arrow and select the period.
- This period
- This month
- This quarter
- This year
- This financial year
- Last period
- Last month
- Last quarter
- Last year
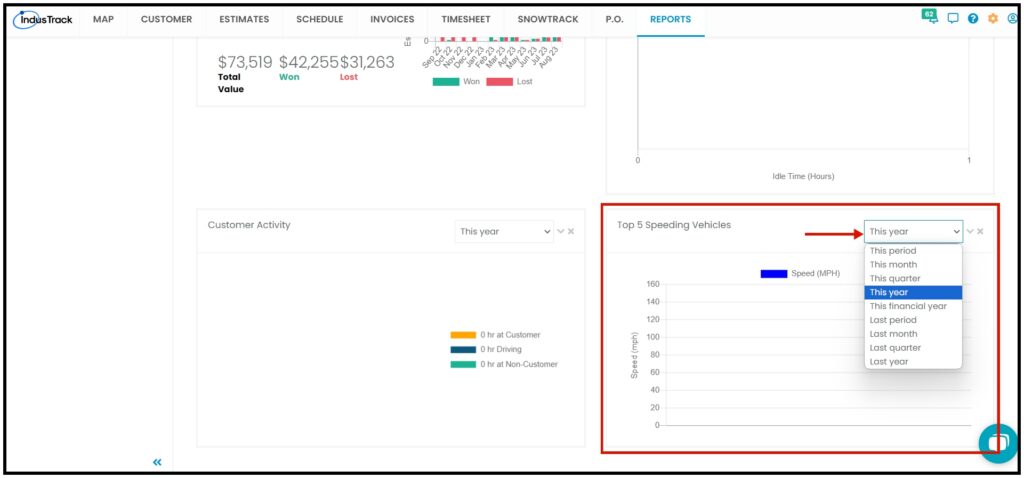
Top 5 Speeding Vehicles
In this report, you can find the Top 5 vehicles that have the most speed by mph in a given period.
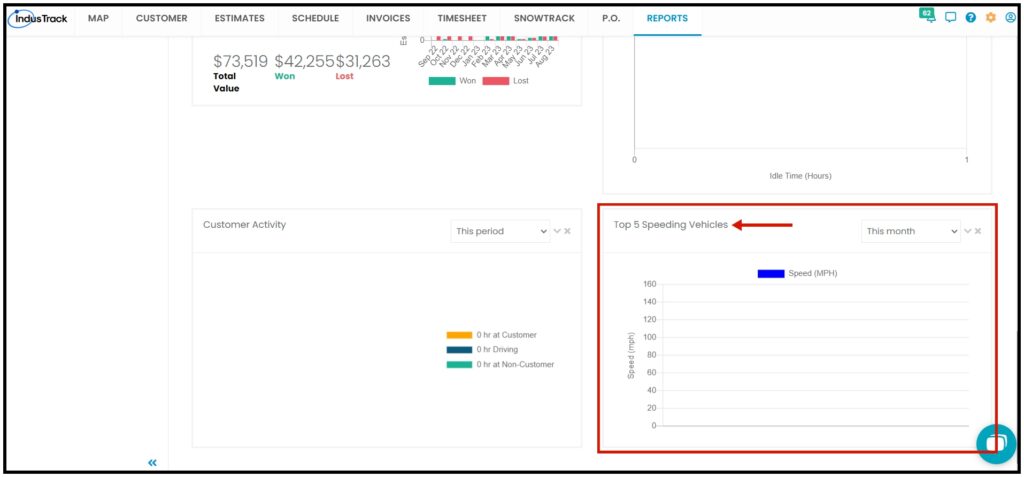
You can also select the period you want to view Top 5 Speeding Vehicles as a summary; click on the drop-down arrow and select the period.
- This period
- This month
- This quarter
- This year
- This financial year
- Last period
- Last month
- Last quarter
- Last year
0 Comments